Visualizing the Biological Clock of the Human Brain
A demonstration of public data exploration in Tellus.
In the opening of Human brain organoids record the passage of time over multiple years (Faravelli, Antón-Bolaños et al., Nature, 2026), the Arlotta lab lays out the premise that makes epigenomics interesting and hard:
These gene expression patterns are tightly coordinated by dynamic changes in the activity of regulatory elements and epigenomic remodelling… pointing at a cell-intrinsic clock that sets the pace of brain development… Recent work has shown the importance of epigenetic barriers that enforce the slow timing of human neuronal maturation, and the role of species-specific rates of mitochondrial metabolism in influencing developmental tempo.
Expression is coordinated by epigenomic remodeling. The clock they’re chasing isn’t written in the transcriptome or the methylome alone, it’s written in the relationship between them. You cannot interrogate a “cell-intrinsic clock” or an “epigenetic barrier” from one modality. The question is multi-modal by construction.
In their headline-worthy paper, the authors show that human brain organoids grown for up to ~5 years in culture continue to mature on the same timeline as the human brain in situ (in your head). Its central conclusions are that this maturation is tracked by an epigenetic (DNA methylation) “clock” whose predicted age correlates tightly with real culture time. They also show that aged progenitor cells retain a “memory” of time spent in vitro, even when reintroduced to a “young cell” environment.
This paper released whole-genome bisulfite methylation and RNA expression across years of organoid culture to public repositories.1 Often “public” and “explorable” are not the same thing. A methylome lives in whole-genome bigWigs; expression lives in raw 10x matrices; the annotation lives in a GFF; and answering a single cross-modal question of your own normally means a genome browser, a plotting library, some bespoke scripting, and an afternoon.
We rebuilt that afternoon into a few clicks. Below is a walk through this dataset in Tellus using the same public data,2 explored across both modalities, with nothing installed and no code required for visualization.
1. Get the data in from wherever it lives
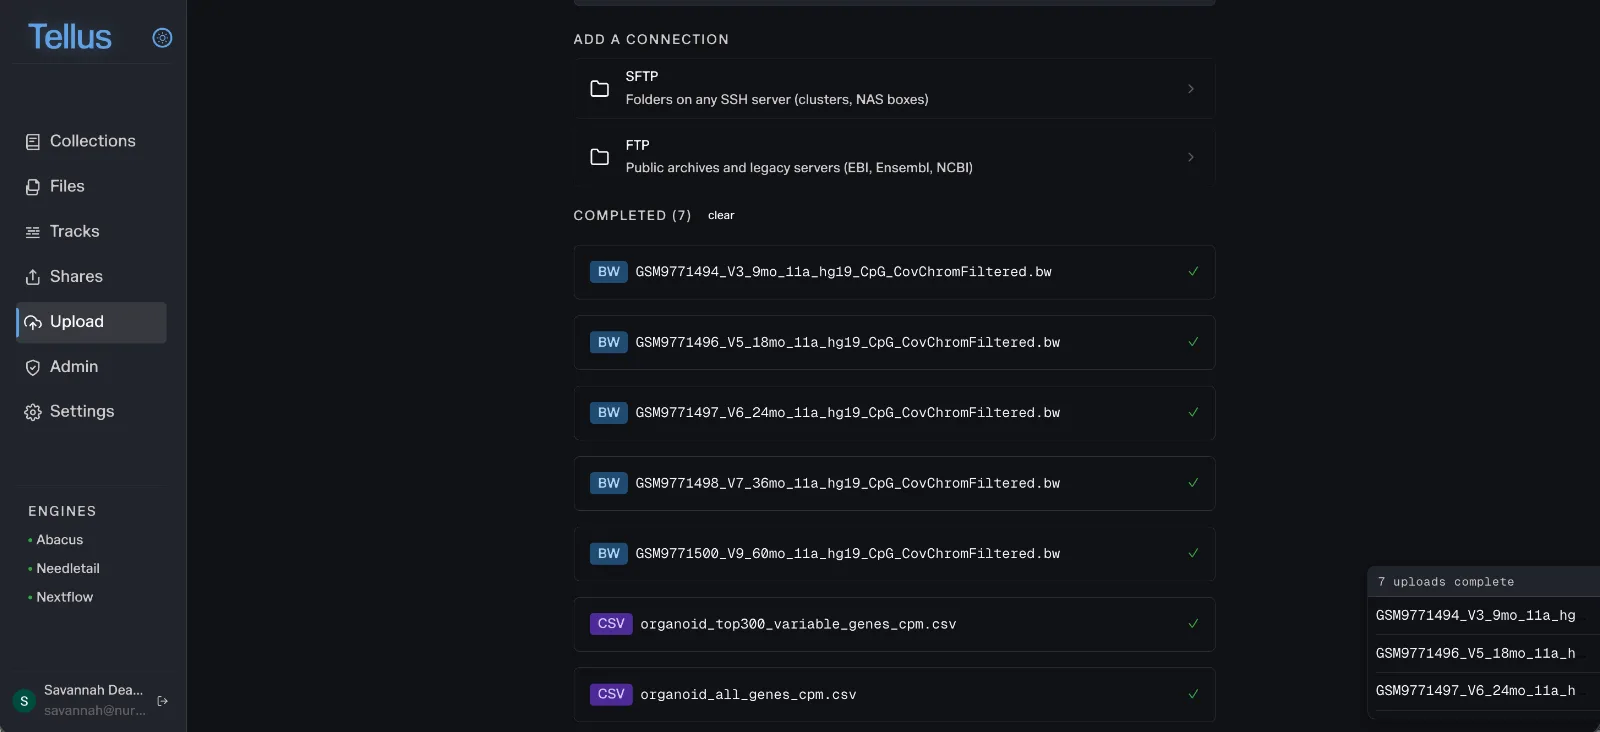
Public epigenomics data is scattered across archives (EBI, Ensembl, NCBI) and, for anything you generated, across clusters and cloud boxes. Tellus connects to both: FTP for public archives, SFTP for your own infrastructure.
Here we’ve pulled the pieces of this study side by side — five whole-genome CpG methylation tracks (bigWig, one organoid line sampled at 9, 18, 24, 36, and 60 months) and the RNA expression tables (counts-per-million, compiled from the public data), all in one place. Behind the scenes, Tellus profiles each file on the way in so it is queryable the moment it lands.
2. Explore the data
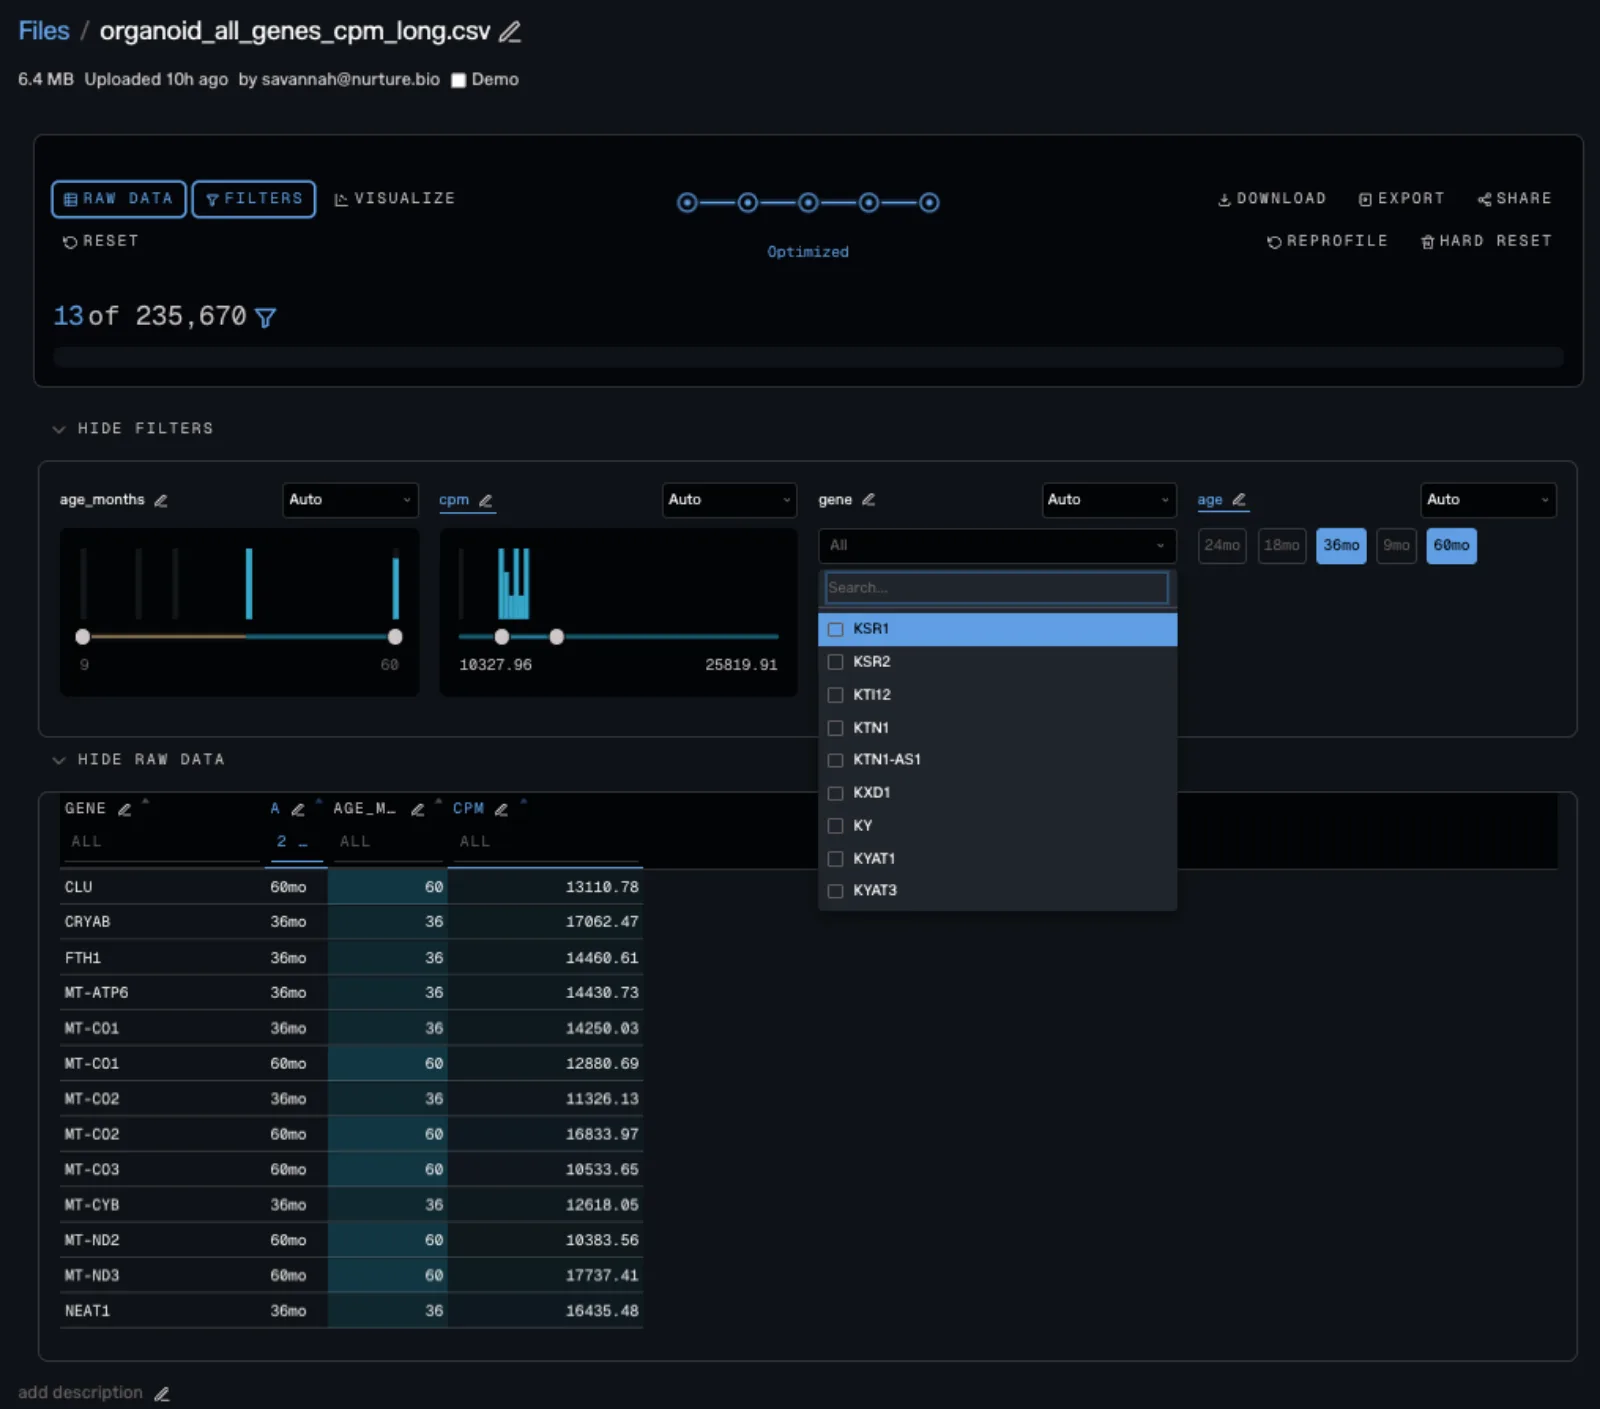
The full expression table is 235,670 rows. You can filter in place by age, by CPM, by gene. Filter to the late timepoints and sort by expression to identify genes that dominate later in the maturation curve: the top of the list is dominated by mitochondrial genes (MT-CO1/2/3, MT-ATP6, MT-CYB, MT-ND2/3) alongside stress and glial transcripts like FTH1, NEAT1, CLU and CRYAB. Mitochondrial metabolism is the exact axis the paper flags as a pacemaker of developmental tempo, and here it’s sitting at the top of the late-age transcriptome, one filter click away.
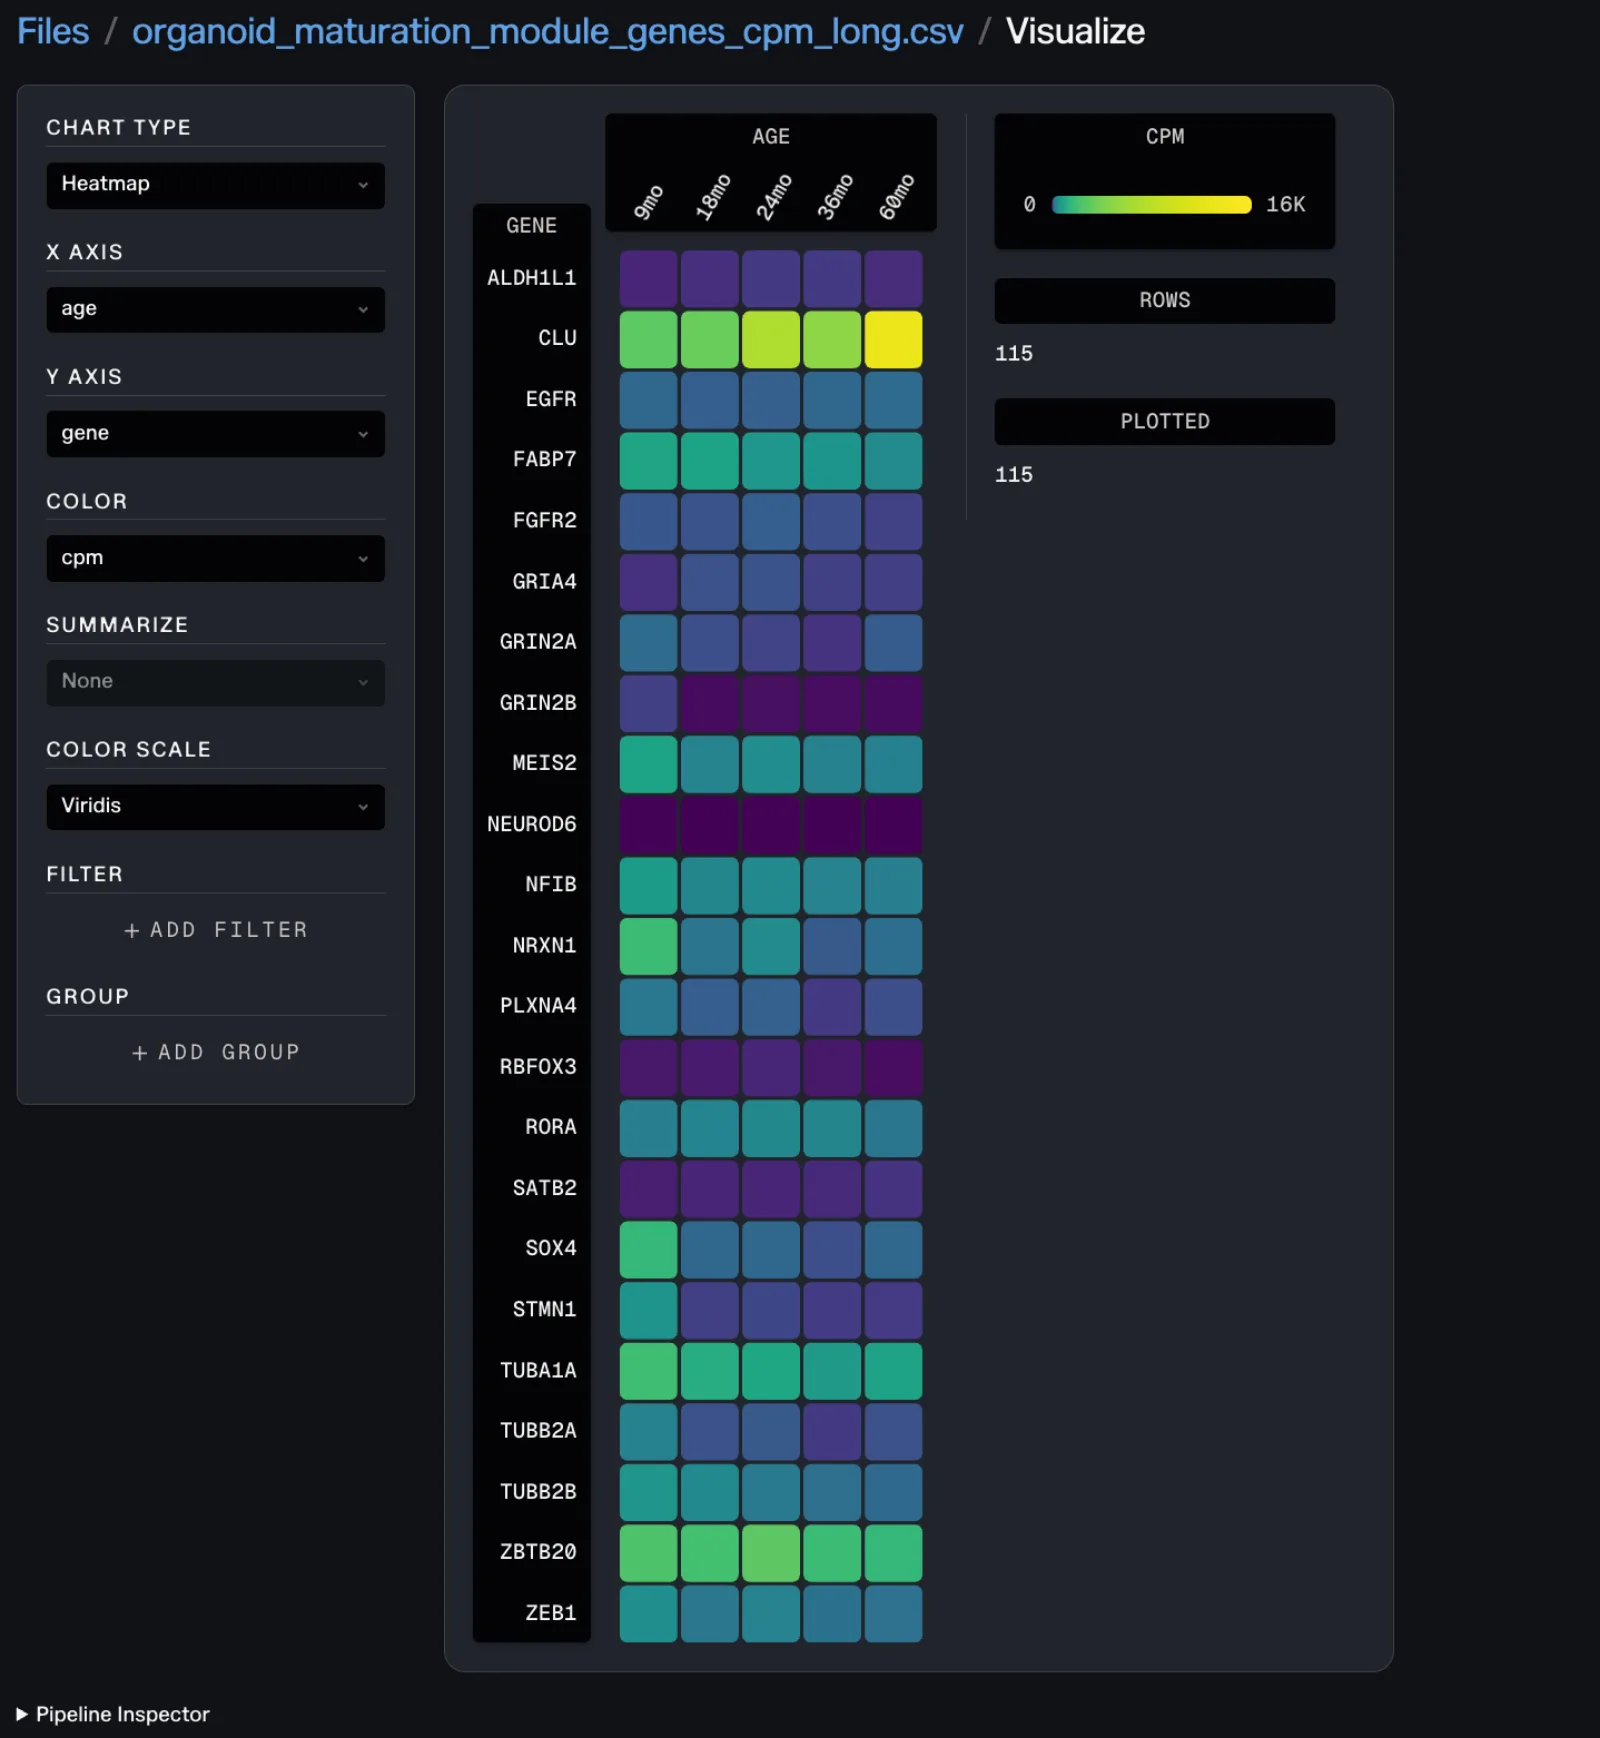
Here we’ve a subset of known maturation related genes as a heatmap using just a few dropdown menu selections with genes on one axis, age on the other, expression as color.
3. Find the outliers and ask new questions
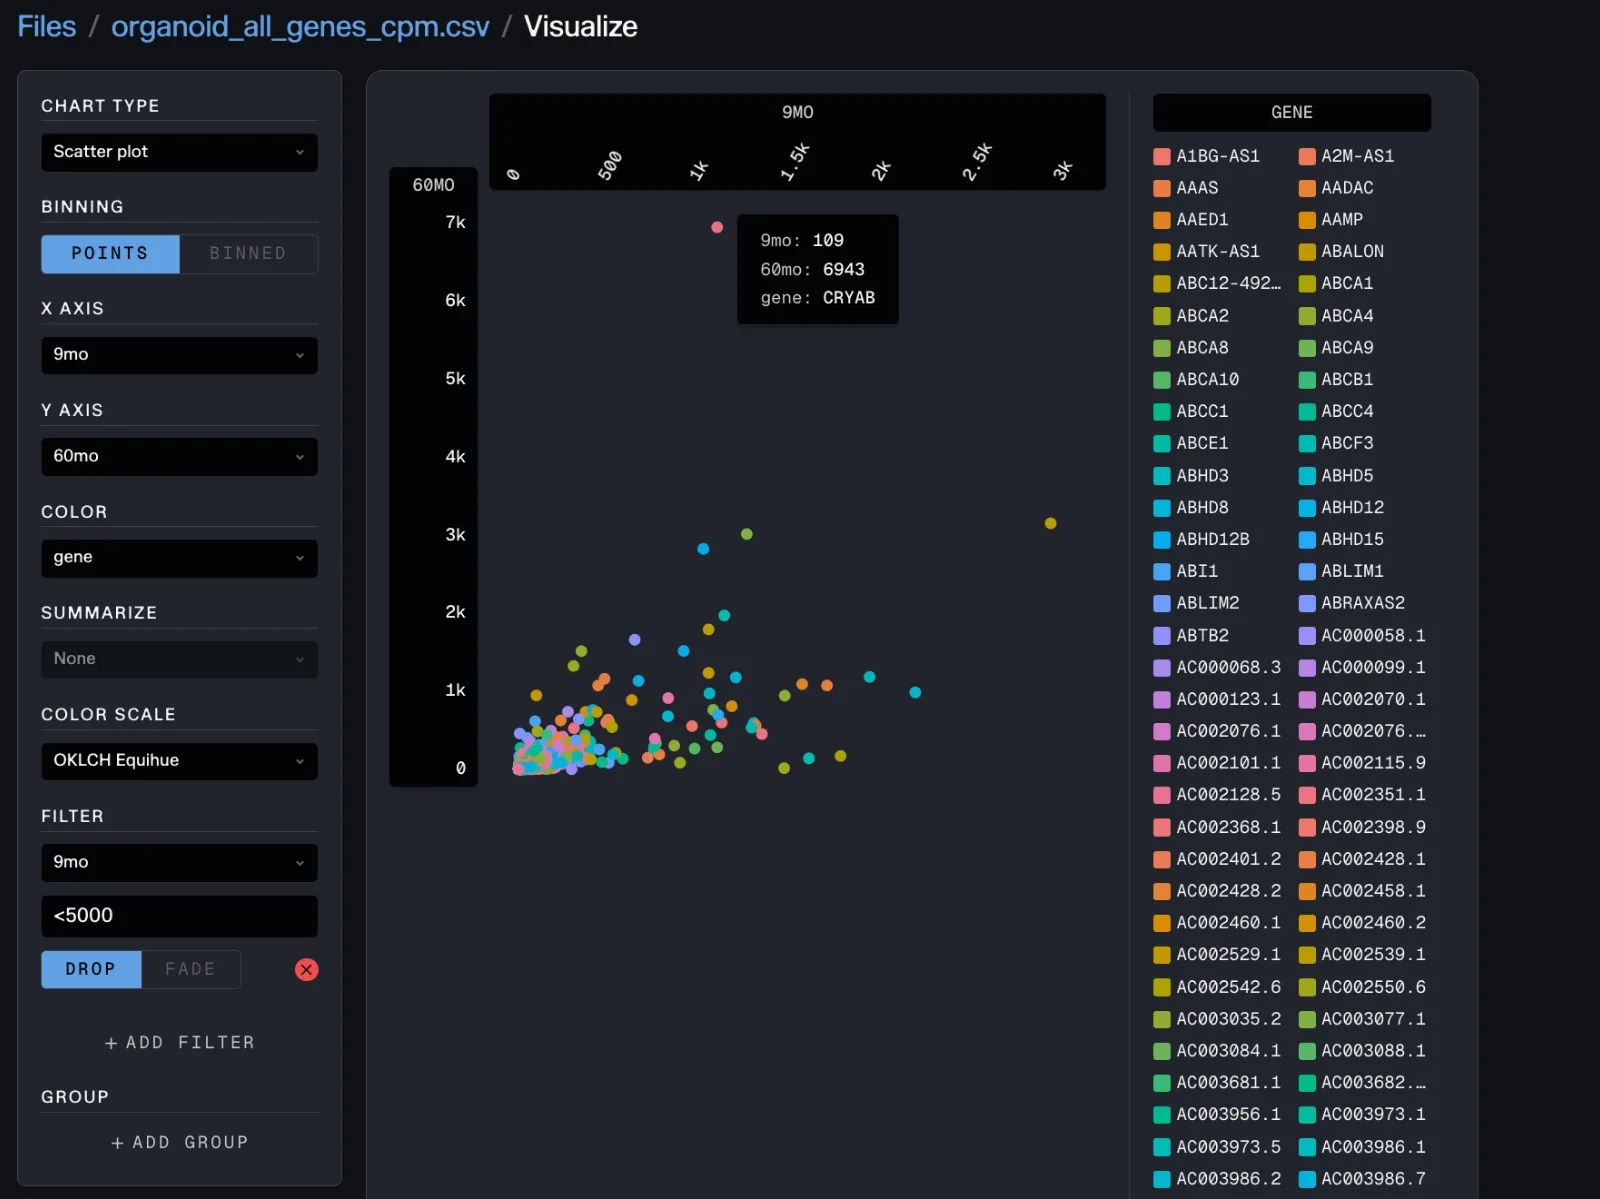
To find what changes the most over five years, a few more clicks can transform the data into a scatter plot of every gene’s youngest timepoint against its oldest with 9 months on one axis, 60 months on the other. Everything on the diagonal is stable; everything pulled off the diagonal is a marker of change. CRYAB (αB-crystallin) is a small heat-shock protein enriched in astrocytes and associated with cellular stress and aging; in the paper it shows up only as an immunostain marking older, glial cells. Here it is notably pulled off diagonal. That’s worth a second look: the paper reports that neurons make up a shrinking fraction of the organoid over time, so a rising bulk signal for a neuronal marker is exactly the kind of tension you’d want to chase down: is it per-neuron upregulation, a composition effect, or an artifact of how CPM is normalized?
The value of a single tool spanning modalities is that the next question costs nothing. That gene lives at a locus; the locus has a methylome. We can explore this locus in Track Stacks overlaying CpG methylation BigWigs at 9 months against 60 months to see if we can find supporting biological signal.
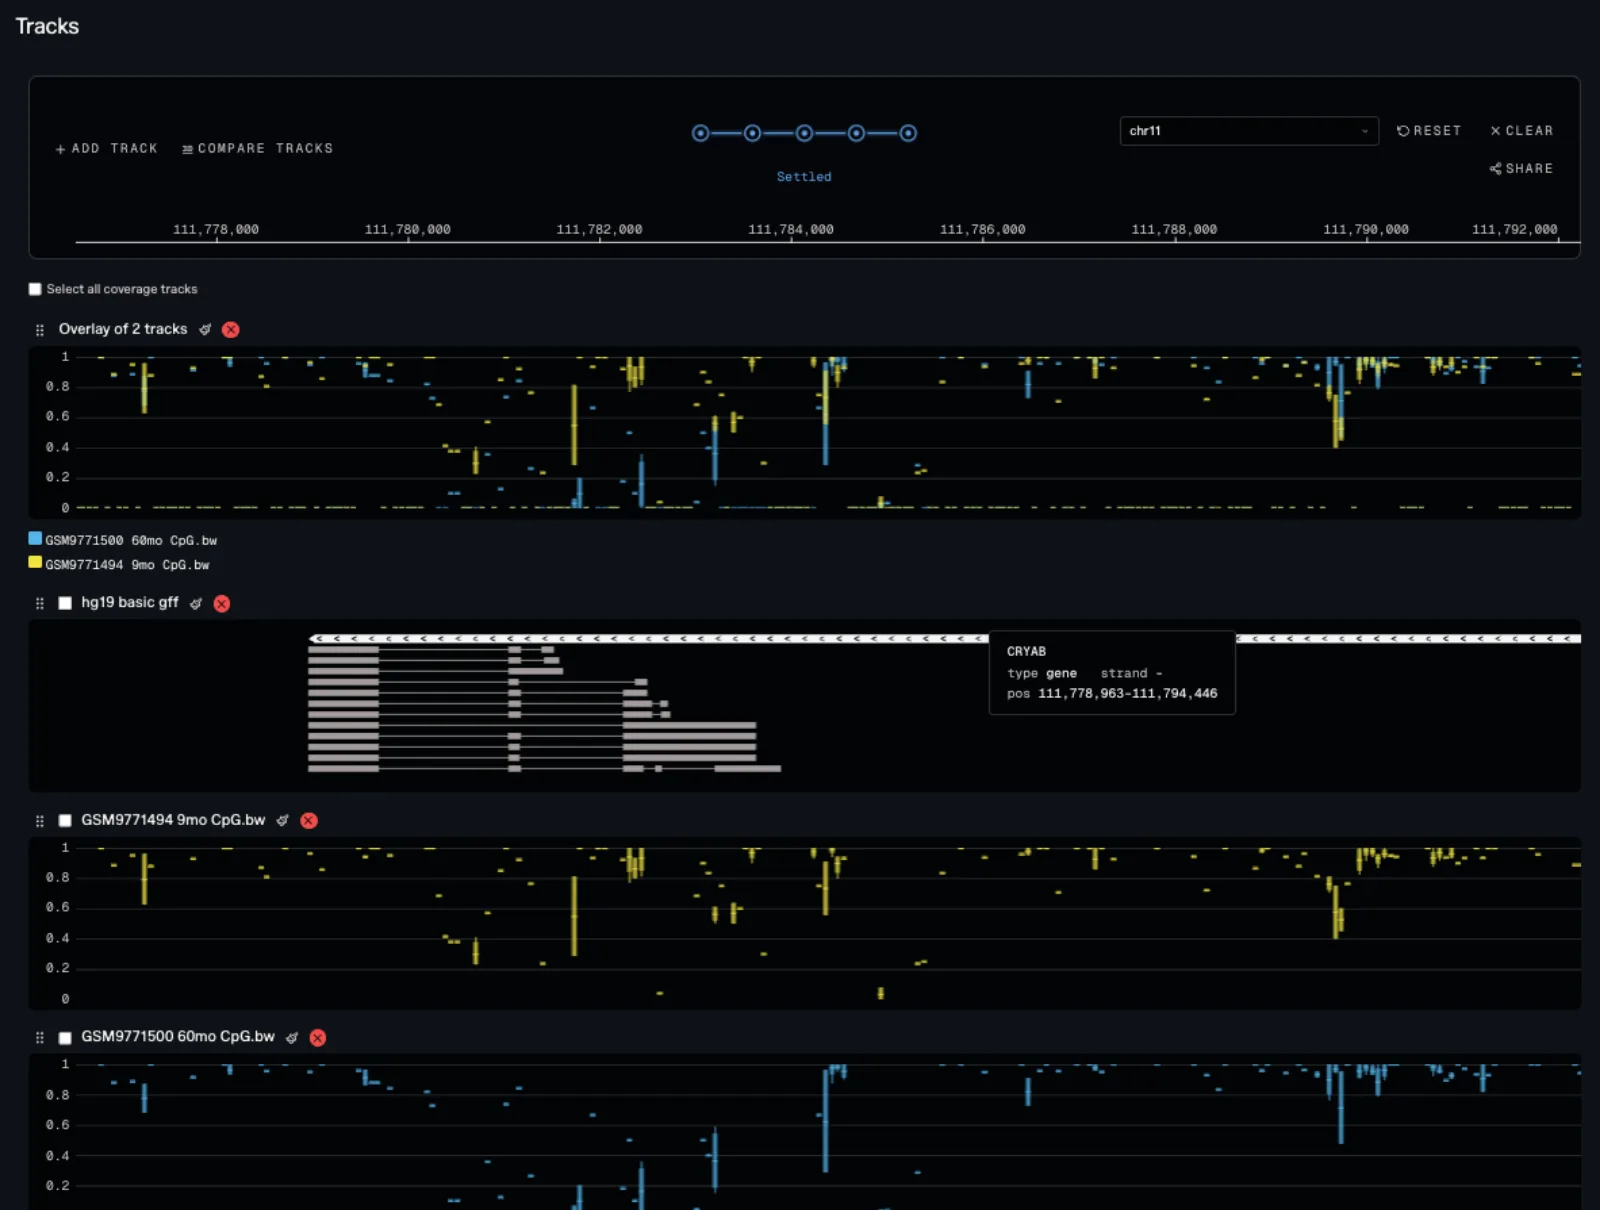
4. Read expression against methylation at a gene the paper is built on
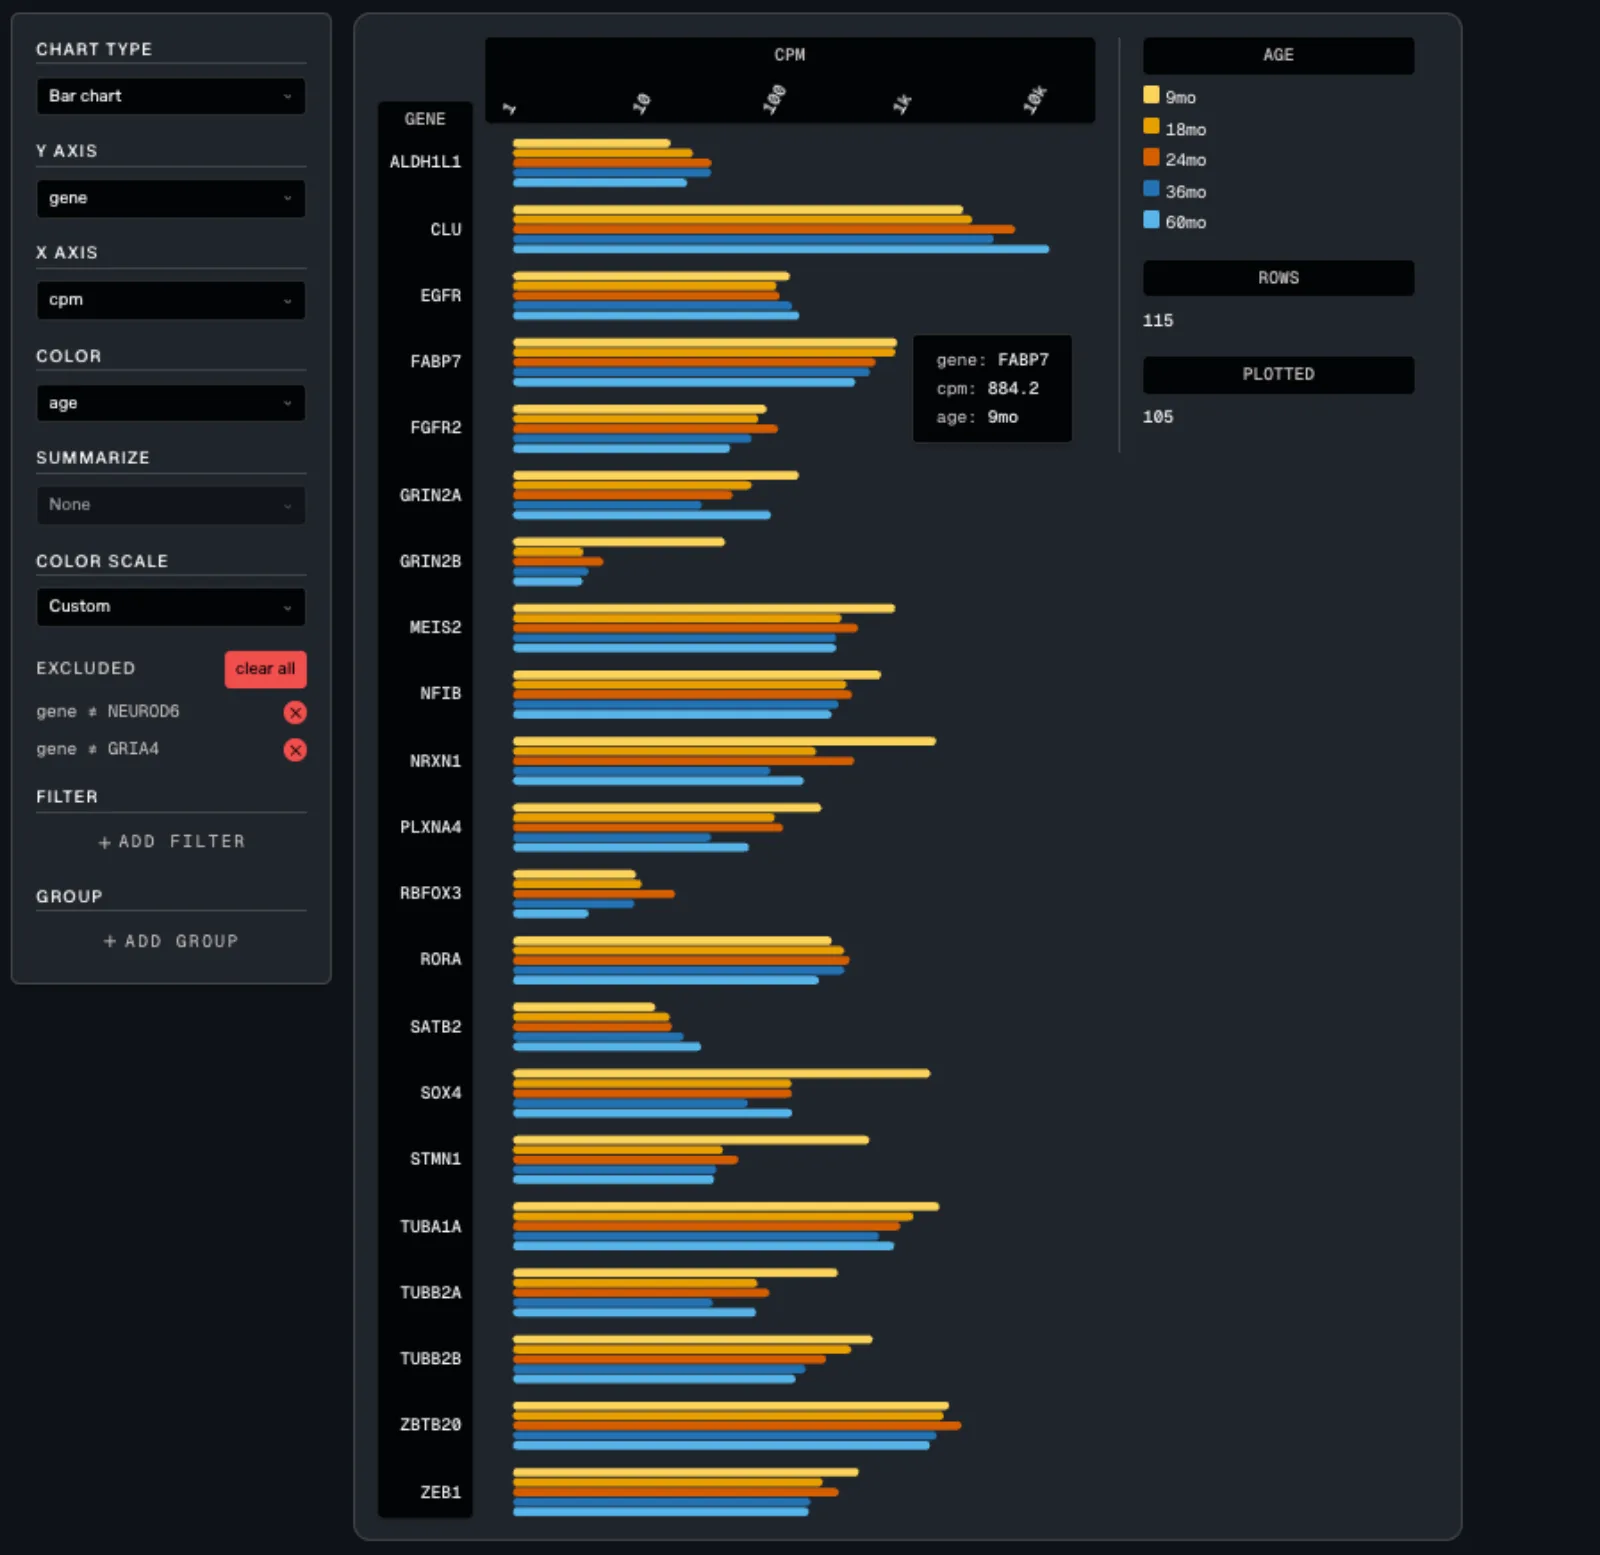
Another few clicks of the gene expression data can build a bar chart for gene expression grouped by age. SATB2 can be identified in this way as a gene that appears to increase in expression with culture age. SATB2 marks callosal projection neurons, the fragile excitatory population.
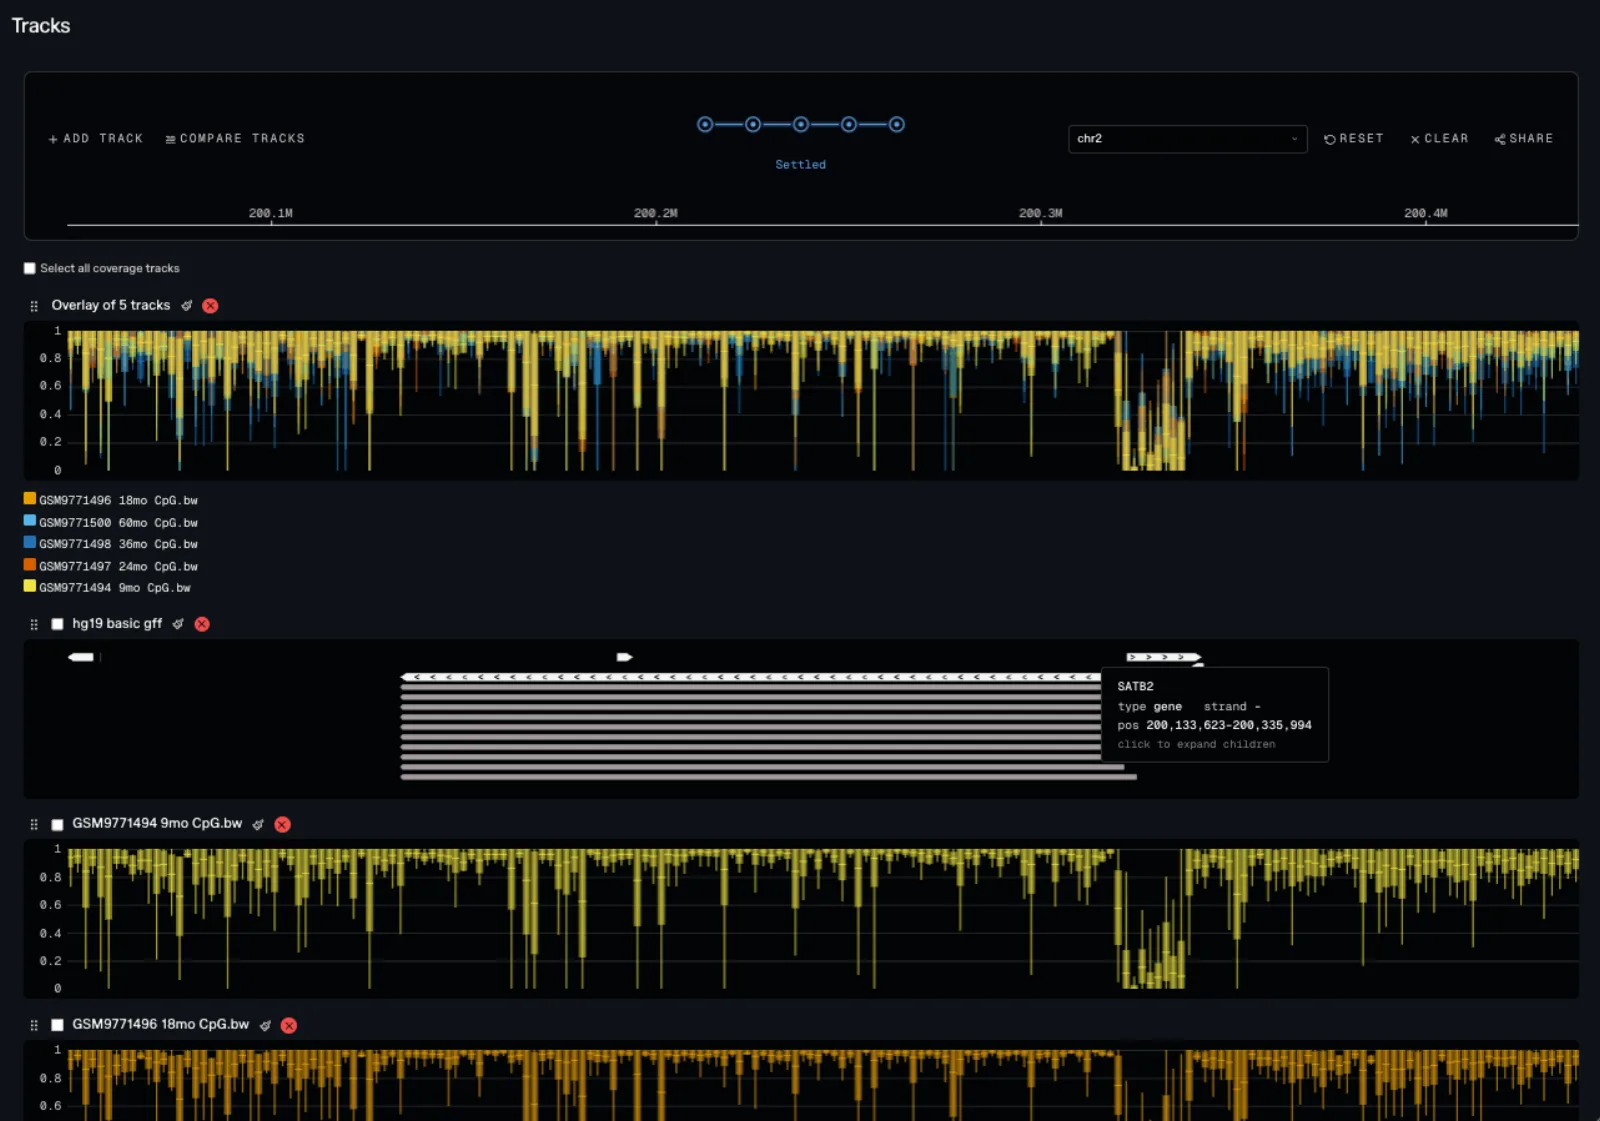
As we did with CRYAB, we can then explore the methylation patterns around SATB2 on the Track Stacks, looking across the span of 5 years of samples at once.
5. Watch the epigenetic clock tick at a fate gene
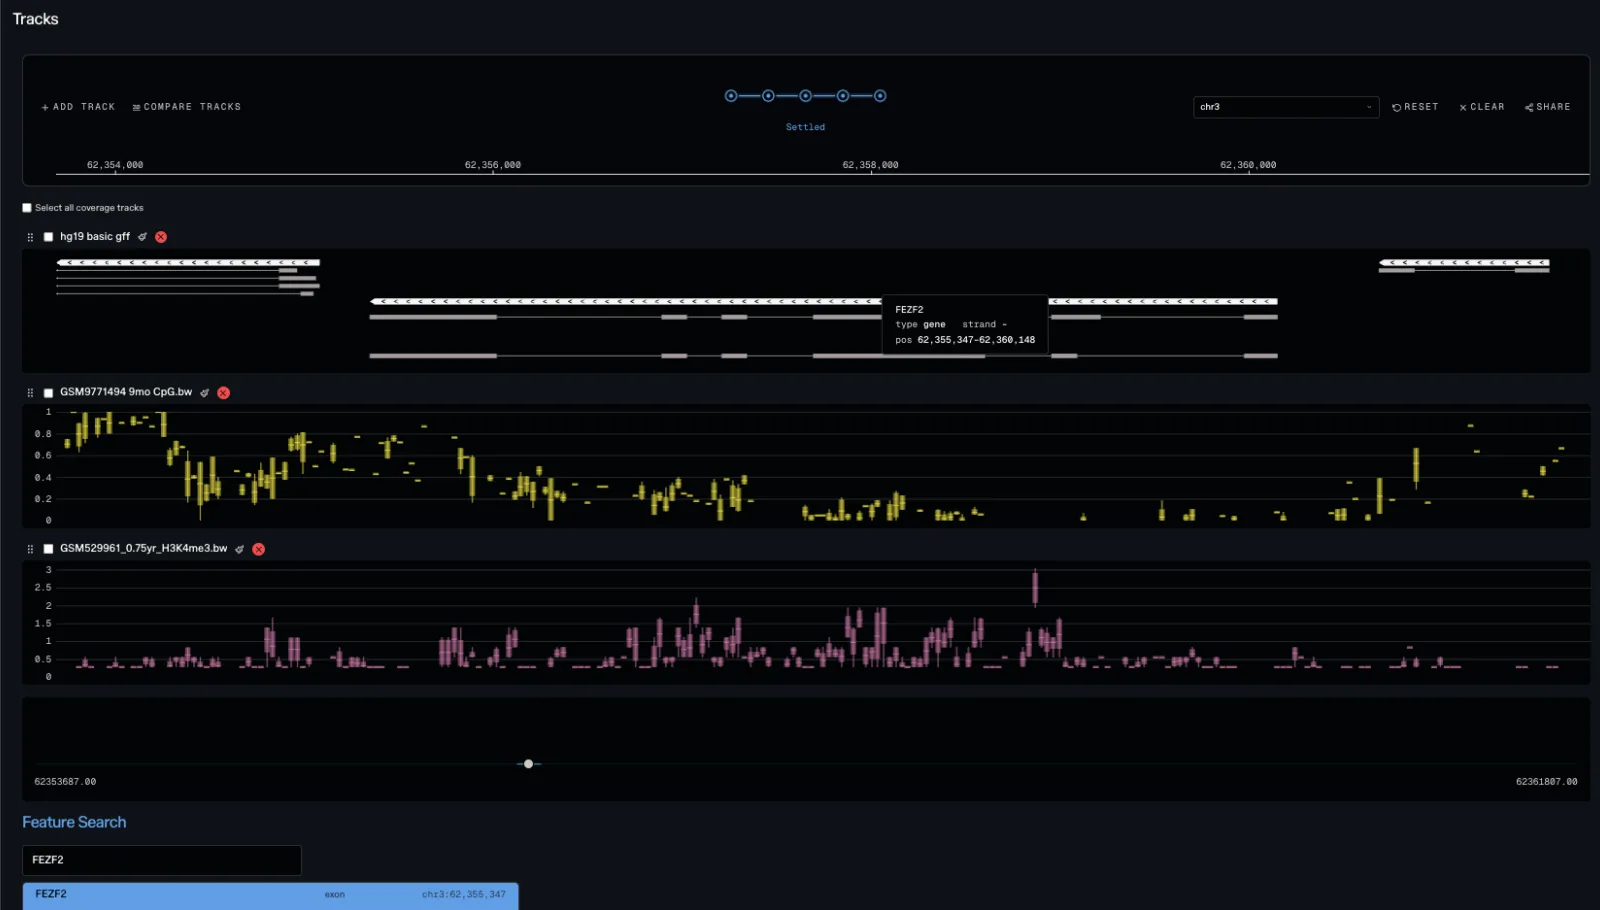
The paper’s central epigenetic claim is that genes governing fate and layer identity gain CpG methylation progressively over time. FEZF2 acts as the master transcription factor for deep-layer, corticospinal neuron identity and it’s one of the loci the authors themselves browse for methylation across timepoints. We can pull it up on chr3, five ages overlaid across the gene body.
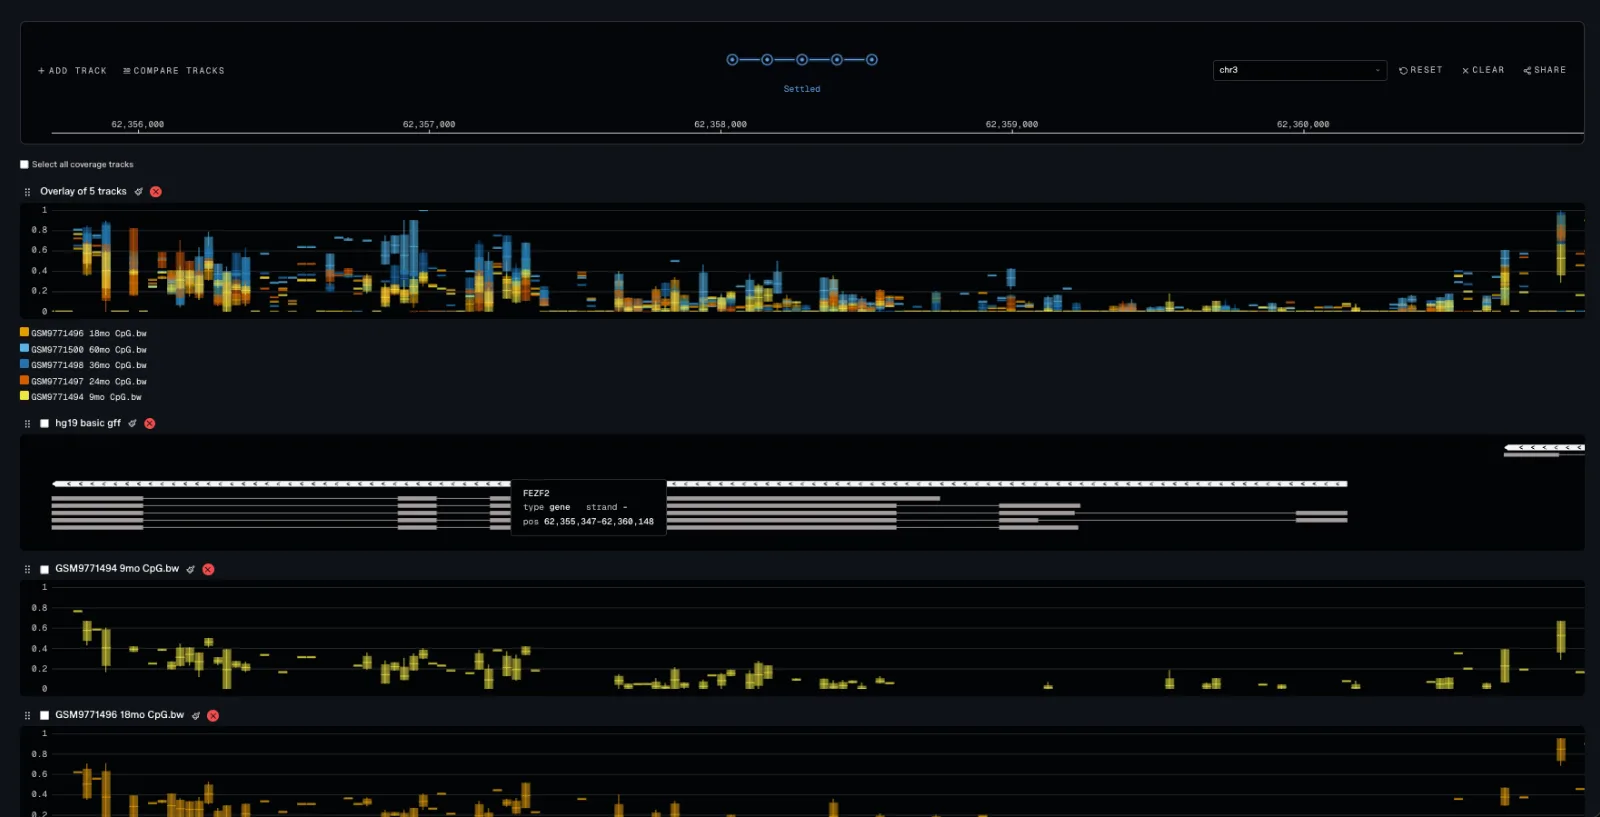
This is the clock made visible: not a summary statistic, but the actual methylation signal accruing over the locus as the organoid ages. It’s the paper’s thesis rendered as something you can scroll through, rather than a number in a table or a static plot in a paper.
6. Overlay with additional publicly available data
Tellus makes it easy to layer additional data pulled from other sources (publicly available or your own). I was interested in seeing a histone methylation track (H3K4me3) from a postmortem donor brain sample of a similar age (0.75) aligned with one of these timepoints (9 months).3 I pulled one from GEO accession GSM529961, from series GSE21172 — “Developmental Regulation and Individual Differences of Neuronal Epigenomes in the Prefrontal Cortex” (Cheung et al. 2010, PNAS, PMID 20421462; Akbarian/Weng labs, Boston University). Here it’s added as a track in pink where we can inspect the same FEZF2 locus. CpG methylation and H3K4me3 histone methylation typically correlate inversely as illustrated by alternating signals between these tracks.
7. Share the exact view, not a screenshot of it
An insight stuck on your laptop isn’t an insight your collaborators have. Every view in Tellus is a shareable link. Hit share, drop the URL into email or Slack, and the person on the other end opens the exact locus, tracks, and settings you were looking at as live data, not a flattened image.
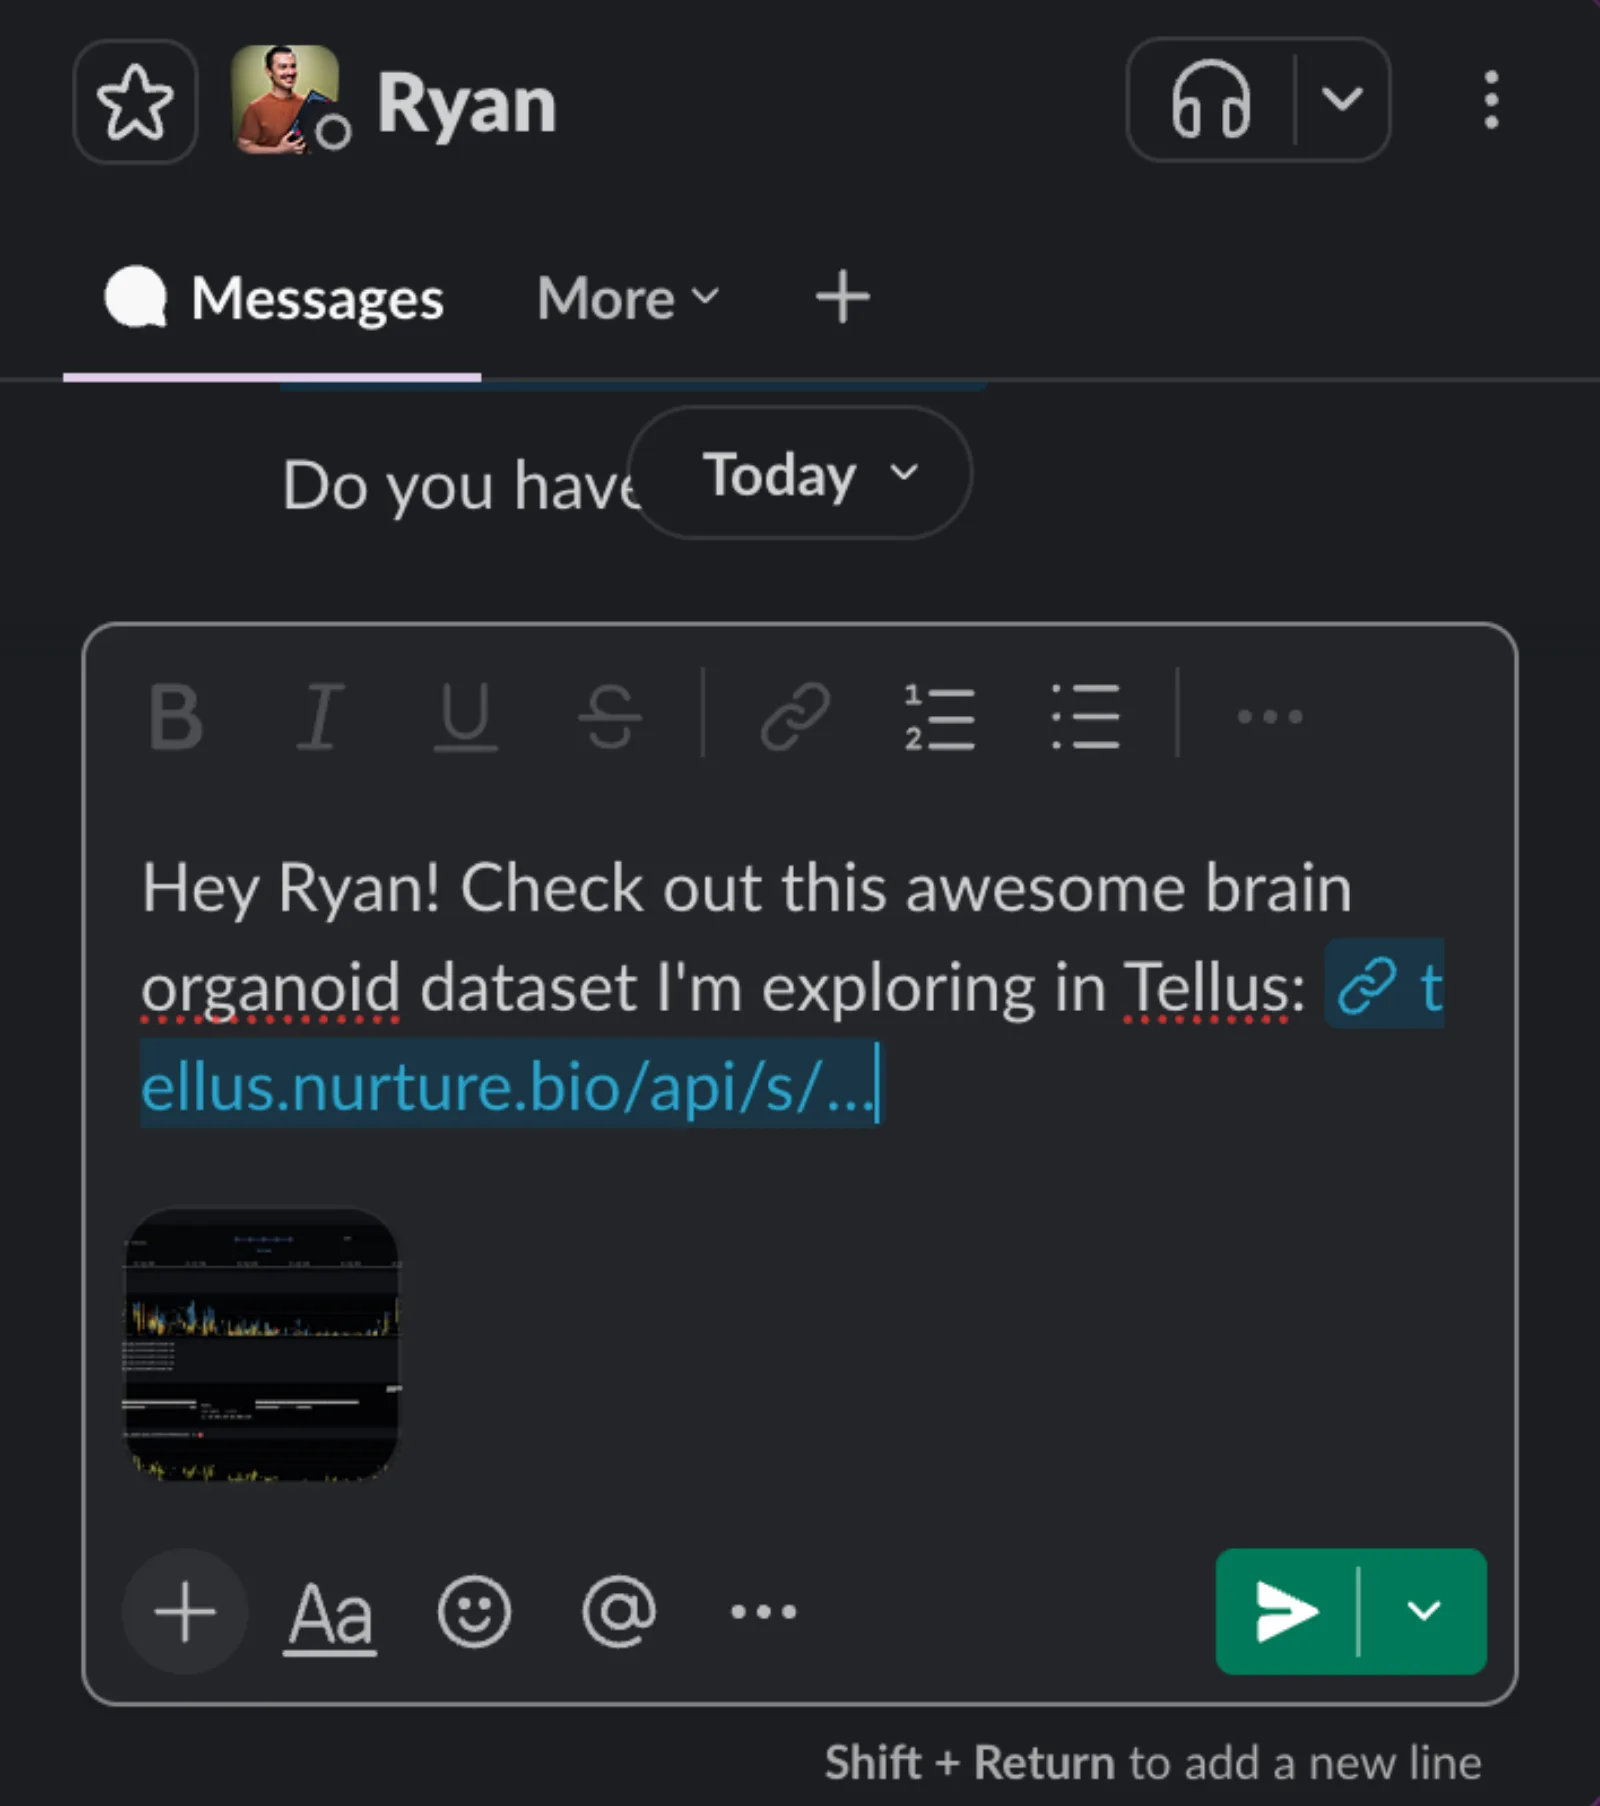
The cross-modal question you just asked becomes something the rest of the lab can pick up and keep asking.
The questions worth asking in epigenomics are inherently combinatorial: clocks, barriers, the coordination between regulatory state and transcription. This dataset is public. So is a great deal of data like it. What’s usually missing is a way to move fluidly across it without stopping to build a pipeline between each step.
That’s what Tellus is for.
Want to explore this dataset? Sign up for our Beta here.
Data from Faravelli, Antón-Bolaños et al., “Human brain organoids record the passage of time over multiple years,” Nature 2026 (doi:10.1038/s41586-026-10877-x), reused under its open-access license. All analysis and visualization shown here was performed in Tellus; the underlying data was generated by the study authors.
Footnotes
-
Methylation data available from GEO GSE333708 and scRNA-seq data available from GEO GSE333707 ↩
-
BigWig files for 9, 18, 24, 36 and 60 months in culture were pulled directly and visualized without any changes; the raw 10x gene matrices were pulled for the matching 5 timepoints, summed over raw UMI counts, and joined by gene symbol across timepoints for ease of demonstration ↩
-
I picked this sample out of GSE21172’s 10 available ages (0.5, 0.58, 0.75, 1.3, 2.8, 4.71, 8.78, 14, 68, 69 yrs) because it lines up best with the organoid 9-month timepoint; it is still not a direct comparison, of course, with one source being from culture and the other in situ ↩
Nurture is building the infrastructure for epigenomics: tools to read it, software to understand it, and systems to remodel it. Tellus, its first product, is in beta.