Transient or Persistent: Reading the Astronaut Epigenome
Whether flight-associated changes in the regulatory genome resolve after return or leave a durable imprint, read across two astronauts in Tellus.

Spaceflight induces several phenotypic changes in the human body that overlap with the hallmarks of aging (López-Otín et al., Cell 2023). These include DNA damage: astronauts from the shuttle era showed blood-cell mutations linked to higher cancer and heart disease risk (Brojakowska et al., Commun Biol 2022), and the NASA Twins Study found genetic instability and unusual changes in telomeres, the protective caps on chromosomes that track cellular aging (Garrett-Bakelman et al., Science 2019). I believe what remains unresolved yet is persistence: whether flight-associated changes in the regulatory genome resolve after return or leave a durable imprint, and whether any such imprint involves the age-associated CpGs on which epigenetic clocks are trained (Horvath, Genome Biol 2013).
Ao et al. (Sci Rep, 2025) profiled whole blood from two crew members of Axiom Mission 1 (AX-1), a 17-day LEO mission, in low Earth orbit, at three points: two weeks before launch, 24 hours after returning to Earth, and three months after return. They paired Illumina EPIC methylation arrays with bulk RNA-seq. Their abstract frames the results as two distinct kinetic patterns:
Epigenetic analysis identified four methylation patterns that showed transient and persistent changes immediately after the spaceflight.
Separating those kinetics is inherently a two-modality problem. I was interested in exploring how Tellus handles exactly this kind of question. The walkthrough below takes both data layers through it, from ingestion to individual loci, and tests which of the paper’s conclusions hold up when methylation, expression, and genomic context are read together.
1. Aligning a probe-indexed methylome with a gene-indexed transcriptome
Data for a study like this is a distributed engineering problem. The two layers are deposited as separate NCBI GEO series (GSE276323, GSE276490), the subject and timepoint metadata in NASA’s Open Science Data Repository (OSD-943, OSD-903), and the probe annotation in a third record (Illumina GPL21145).
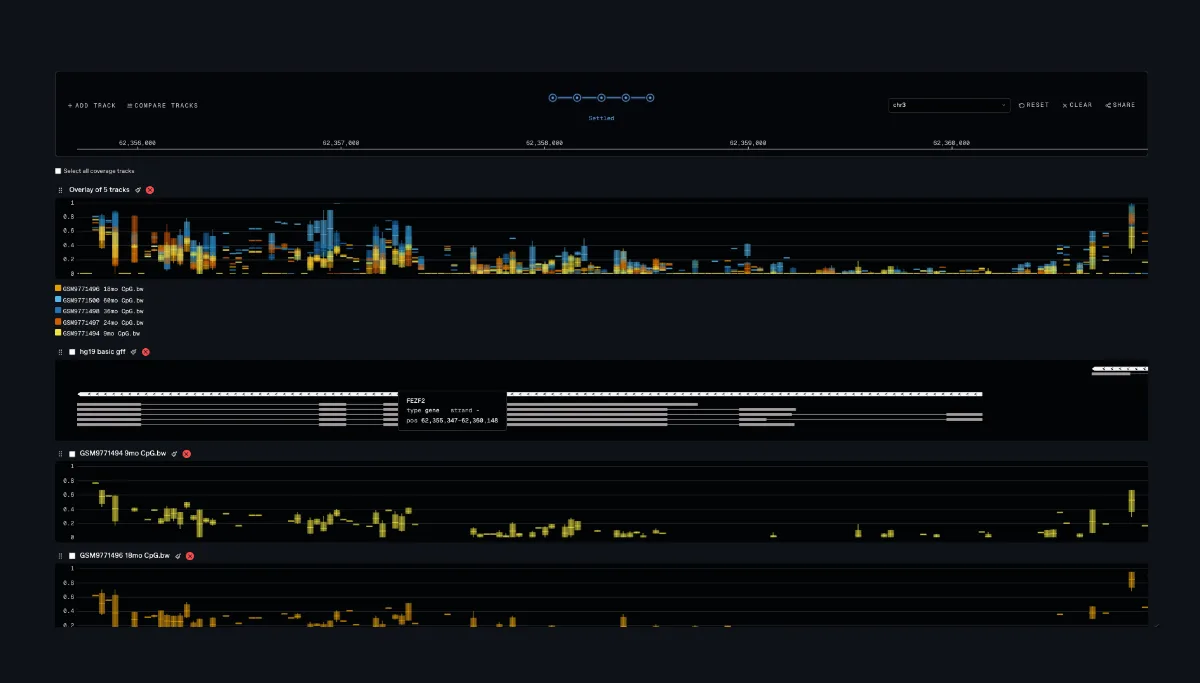
Since the EPIC probes are identifiers, and not the coordinates, each was mapped to hg19 (CHR, MAPINFO from GPL21145), annotated against UCSC RefSeq (promoter = TSS −1,500 to +500 bp; gene body; intergenic) and written to a per-sample bigWig at single-CpG resolution.
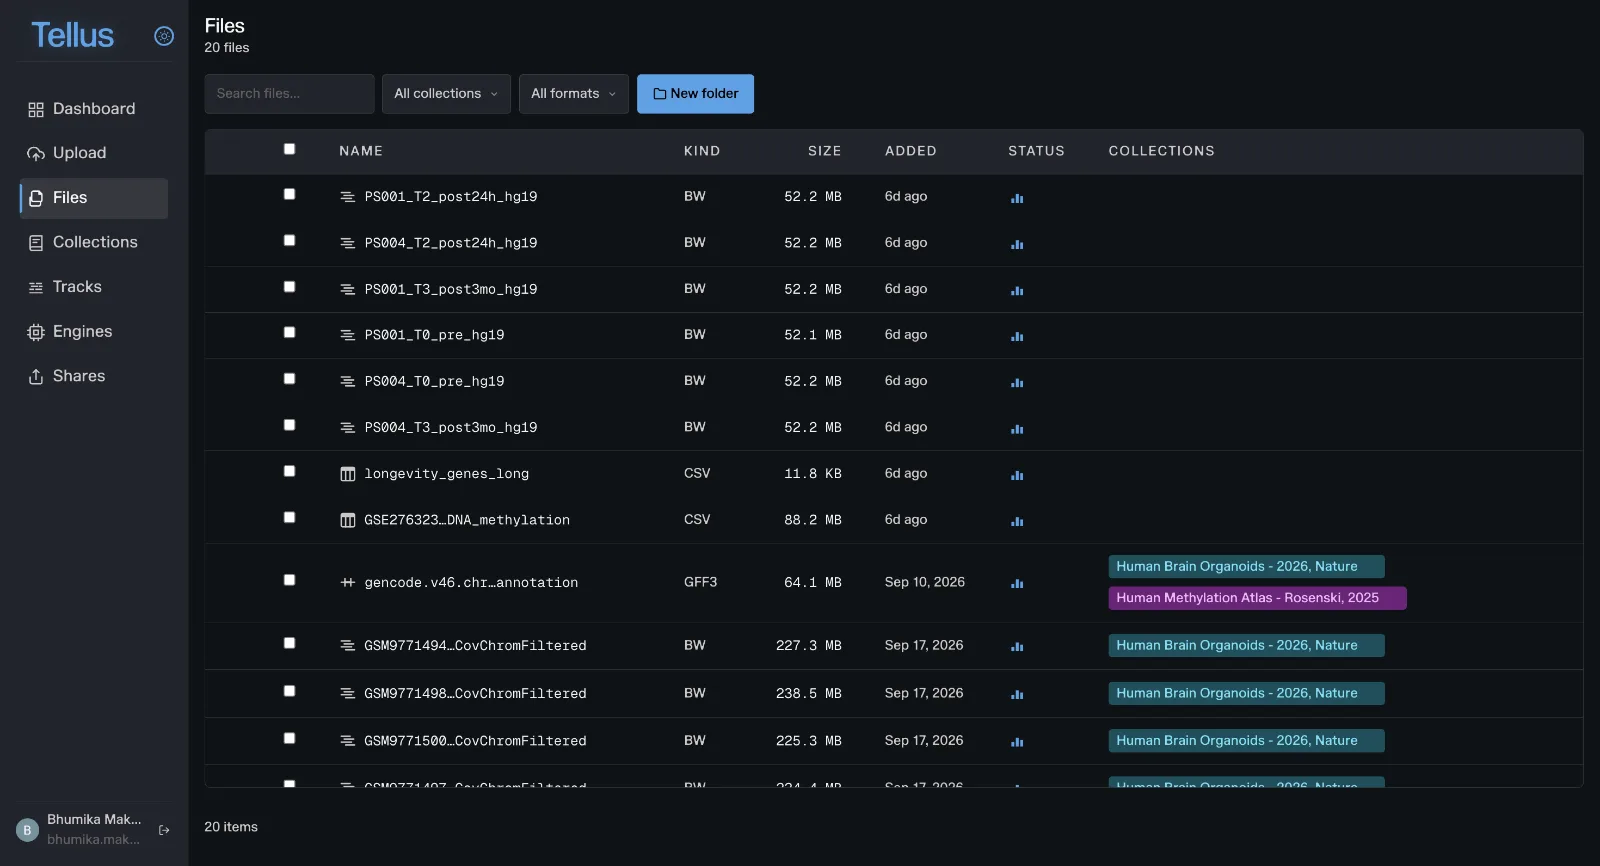
The study is organized in a single workspace containing:
- Six CpG methylation tracks (bigWig, ~52 MB each) for crew members PS001 and PS004 at three timepoints: L−2 wk (T0), R+24 h (T2) and R+3 mo (T3).
- The normalized EPIC β matrix (776,047 CpGs passing QC × 6 samples, 88 MB).
- A long-format expression table (gene, sample, TPM) for the longevity panel, derived from GSE276490.
2. Gene activity returns to baseline: the longevity panel
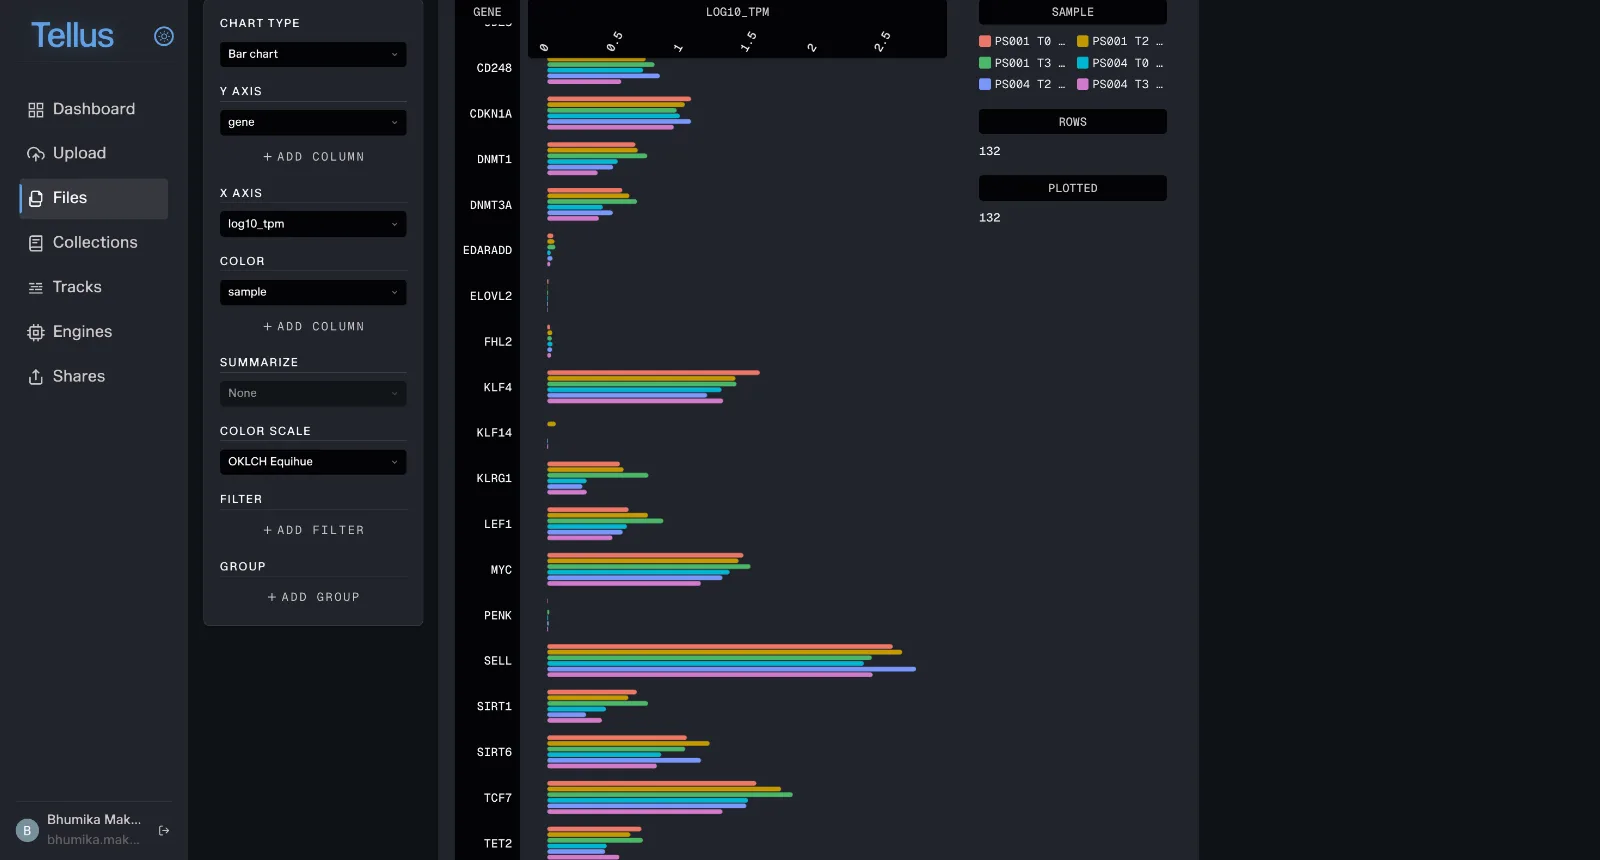
Expression changes after flight were mostly transient and returned to baseline by three months, and no single gene passed genome-wide significance, the paper (Sci Rep, 2025) describes.
What Tellus shows — A panel of about 30 longevity genes was plotted per sample: reprogramming factors (KLF4, MYC), DNA methylation enzymes (DNMT1, DNMT3A, TET2), sirtuins (SIRT1, SIRT6), the senescence gene CDKN1A, T-cell markers (SELL, LEF1, TCF7, KLRG1) and genes that carry well-known epigenetic clock sites (ELOVL2, FHL2, KLF14, PENK). No gene changed 2-fold or more in both astronauts, at 24 hours or at three months. The one shared change, SELL (CD62L), rose at 24 hours and settled by three months.
3. A lasting methylation gain in an apoptosis gene: BCL2
CpG sites that changed after flight were enriched in apoptosis pathways. Apoptosis is programmed cell death, the process the body uses to remove damaged or unneeded cells. One of the four methylation patterns, a gain at 24 hours that was still present three months later, was linked to apoptotic signalling (Sci Rep, 2025). This matters because methylation helps control whether a gene is switched on or off, so a lasting change suggests spaceflight may leave a durable mark on how cells decide to survive or die. That same balance is central to aging, cancer, and tissue repair.
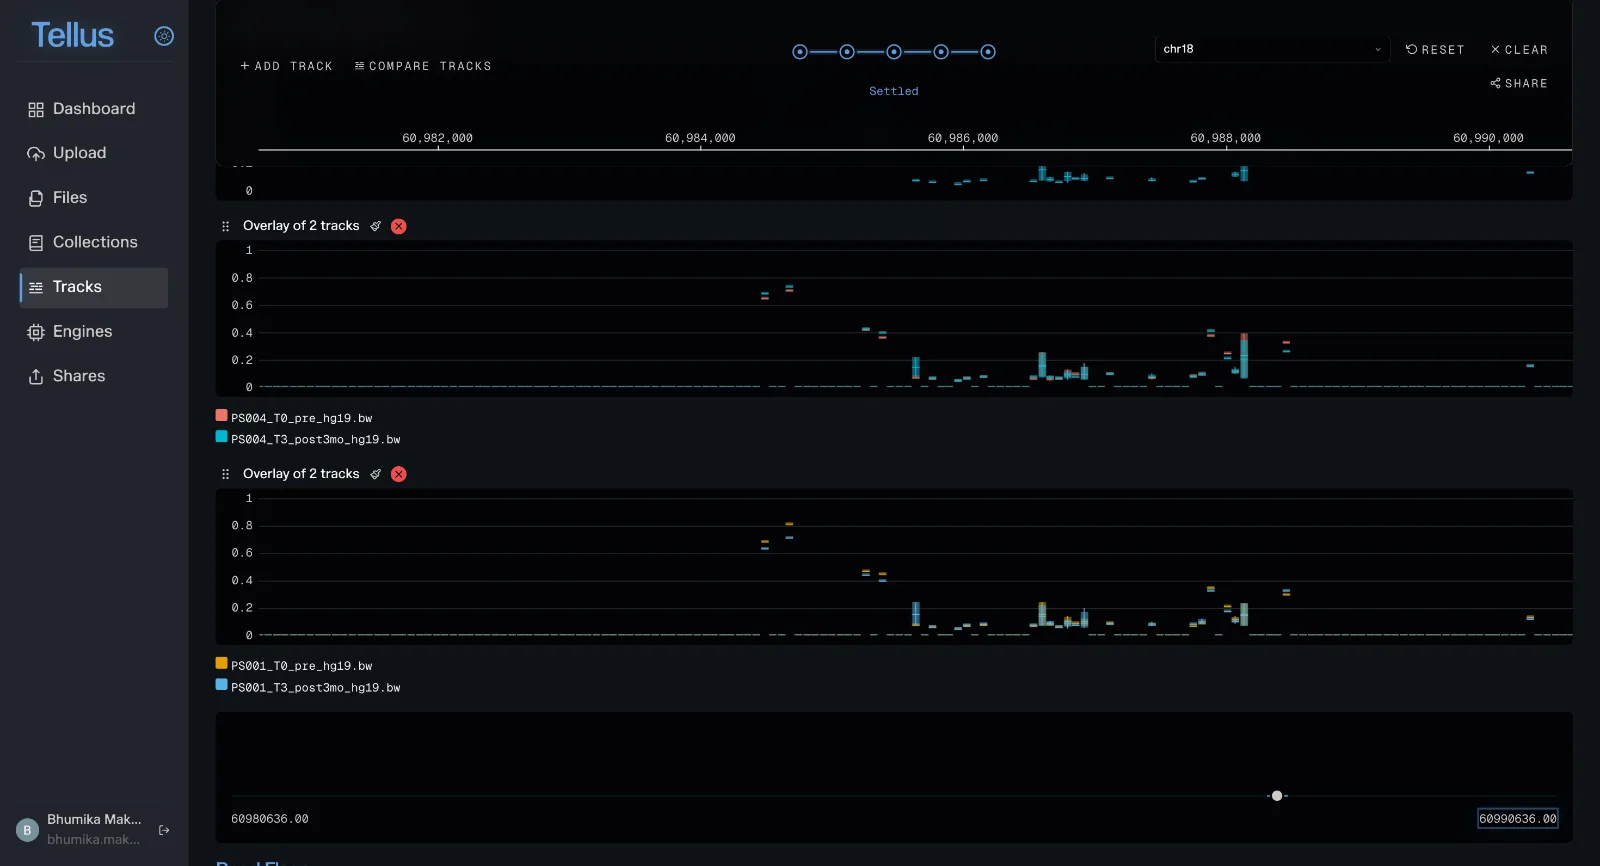
What Tellus shows — A CpG in BCL2, at chr18:60,985,636 gains methylation after flight and is still higher at three months in both astronauts (mean Δβ +0.16 at R+3 mo). Across all sites that changed in both astronauts, apoptosis genes are over-represented about 1.6-fold (FDR < 0.1). BCL2 expression did not change in step, so whether this gain raises or lowers cell death is still open.
4. A late methylation gain in a nervous-system gene: BDNF
The largest methylation pattern, a transient gain at 24 hours, was enriched for nervous system development genes, the paper (Sci Rep, 2025) describes.
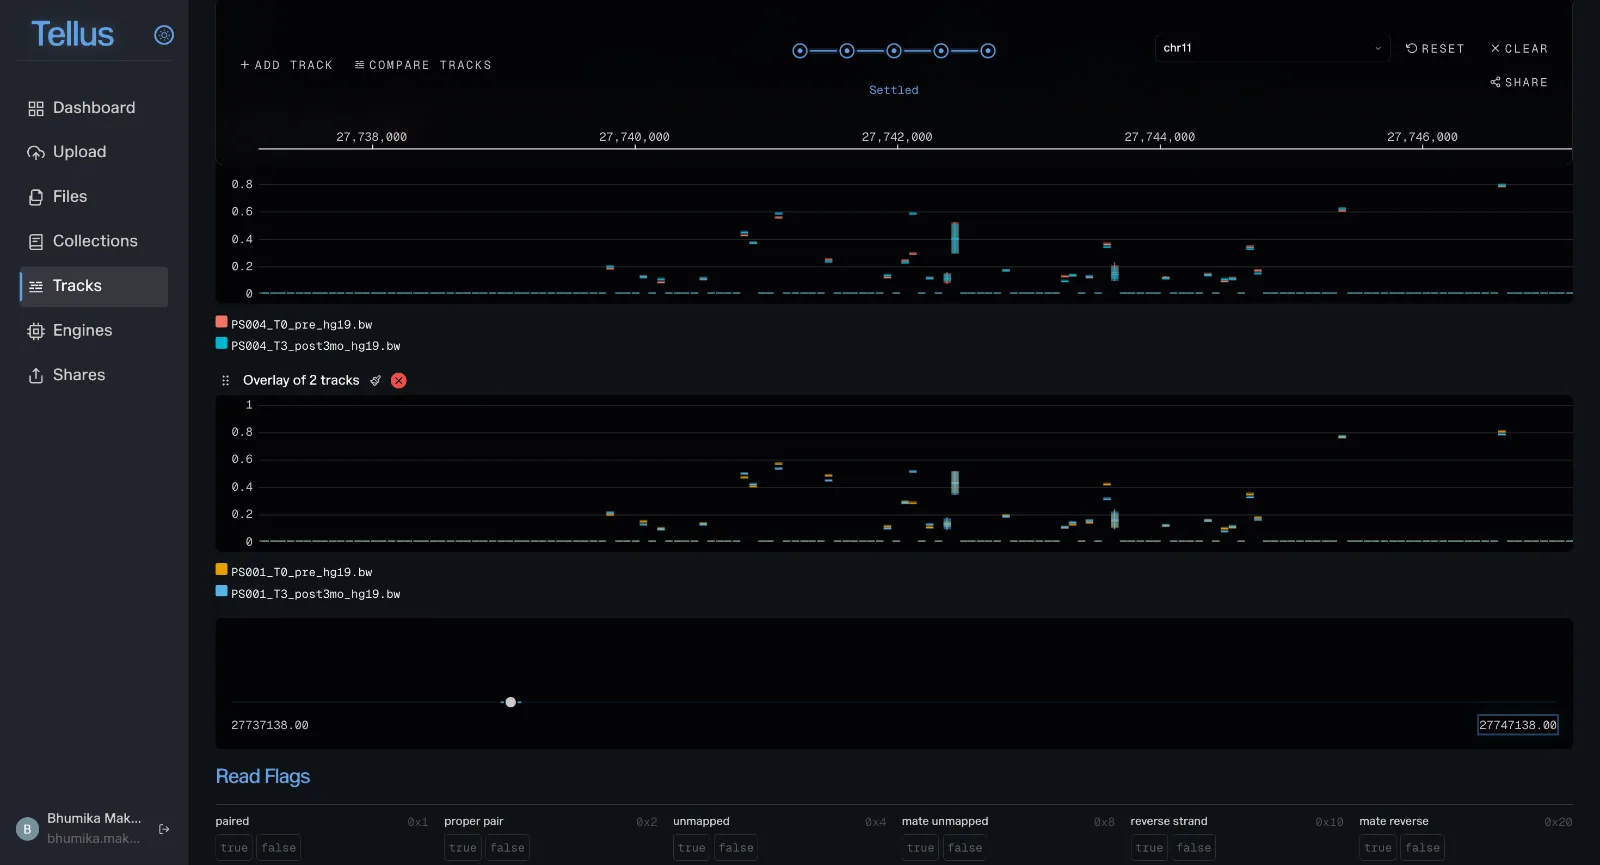
What Tellus shows — A CpG in BDNF, a growth factor for nerve cells, at chr11:27,742,138 is higher at three months in both astronauts (mean Δβ ≈ +0.26) but had not changed at 24 hours (|Δβ| < 0.10). Nervous system genes are over-represented about 1.6-fold among all changed sites.
What this adds up to
The three views sit inside a consistent genome-wide picture. Only 851 of 776,047 CpGs (0.11%) changed in both astronauts, mostly gains, and 74% of them lie in promoters against 31% across the array; 195 were still changed at three months. Changed sites lean toward muscle, nervous system, gene regulation, apoptosis and bone genes (1.6–1.8× more than expected by chance).
Spaceflight biology is a multi-layer problem by nature: methylation, expression, cell composition and timing all have to be read together before a change means anything. The AX-1 data is public, and so is a growing body of data from other crews in GEO and NASA’s OSDR. What usually slows the work is the plumbing between layers. With them in one place, the next questions (do these sites hold in other crews, do the clocks agree, does BCL2 methylation track its expression) become an afternoon of exploration rather than a new pipeline each time.
Data: Ao et al., “Longitudinal transcriptomic and epigenetic analysis of the blood in two astronauts,” Sci Rep 2025 (GEO GSE276323, GSE276490; NASA OSDR OSD-943, OSD-903). Probe positions: Illumina GPL21145. Annotation: UCSC RefSeq hg19; GO Biological Process 2023. Visualization in Tellus.
Nurture is building the infrastructure for epigenomics: tools to read it, software to understand it, and systems to remodel it. Tellus is in beta. Request access if you want to run your own data through it.